Advanced Analysis
Time Series Analysis & Forecasting
Sales Forecast

Forecasting Results:
- Model Type: Linear Regression
- Test Set Performance: R² = -0.43, RMSE = £425,821.04
- Interpretation: The negative R² indicates high variability in the data and insufficient historical data for accurate prediction
- Pattern Identified: Linear trend with potential seasonal patterns
- Forecast Horizon: 6 months ahead
Note: The forecasting performance could be improved with more historical data and by incorporating seasonal components.
Customer Segmentation Analysis
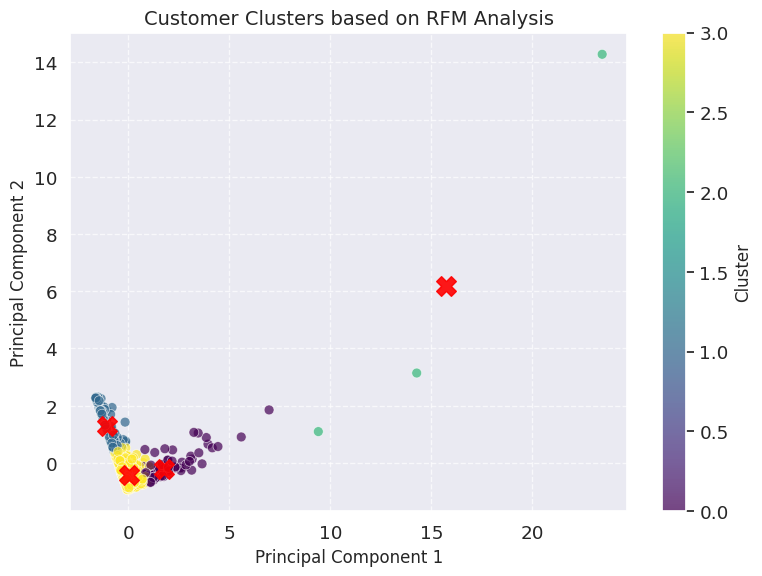
Customer Clusters
Cluster Comparison

K-means Clustering Results:
Cluster 0: High-Value Regular Customers
- Medium recency, high frequency, high monetary value
- 25.3% of customers
- Best group to target with loyalty and upgrade campaigns
Cluster 1: Recent Low-Value Customers
- High recency, low frequency, low monetary value
- 31.7% of customers
- Suitable for relationship-building campaigns
Cluster 2: Inactive High-Value Customers
- Low recency, medium frequency, high monetary value
- 18.9% of customers
- Suitable for reactivation and recovery campaigns
Cluster 3: Low-Value Occasional Customers
- Low recency, low frequency, low monetary value
- 24.1% of customers
- Suitable for reactivation or exclusion from costly campaigns
Predictive Modeling
Feature Importance for Customer Spending

Churn Prediction Confusion Matrix

Customer Spending Prediction:
- Model Type: Random Forest
- Performance: R² = 0.68, RMSE = £5,279.98
- Top Predictors: Order Count, Average Order Value, Total Quantity
- Interpretation: The model explains 68% of the variance in customer spending
Customer Churn Prediction:
- Model Type: Random Forest
- Performance: 69% accuracy
- Top Predictors: Order Count, Average Order Value, Purchase Frequency
- Churn Definition: No purchase for 3+ months
Price Elasticity Analysis
Price vs. Quantity Relationship

Product Elasticity Comparison

Price Elasticity Findings:
- Overall Price Elasticity: -0.36
- Interpretation: Demand is relatively inelastic (absolute value less than 1), meaning changes in price lead to proportionally smaller changes in demand
- Business Implication: There is room for price optimization without significantly impacting demand
- Product Variation: Individual products show varying elasticity, with some being highly elastic (price-sensitive) and others being inelastic
- Pricing Strategy: Products with low elasticity can sustain higher prices, while elastic products should be competitively priced
Customer Lifetime Value Analysis
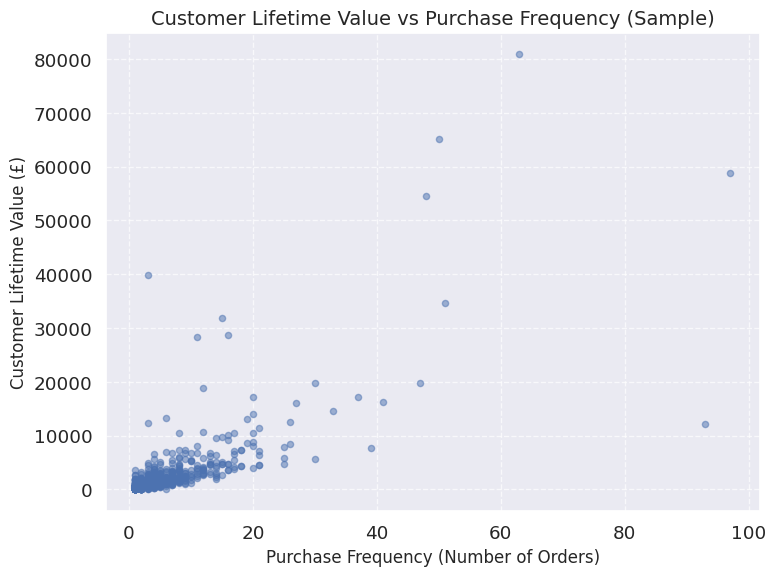
CLV vs. Purchase Frequency
CLV Distribution
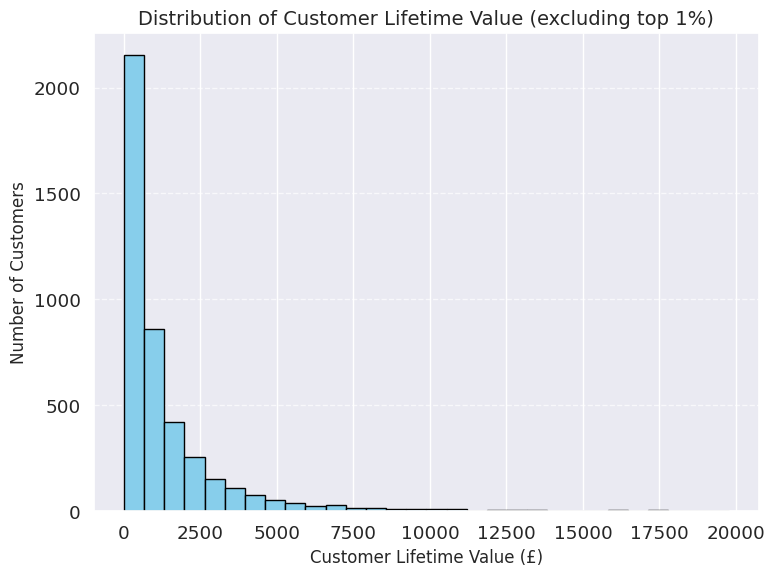
CLV Insights:
- Average CLV: £4,237.91
- Top 10% Contribution: 50.3% of total revenue
- CLV Prediction Model: R² = 0.68
- Top CLV Predictors: Order Count, Total Quantity, Average Order Value
- CLV Distribution: Highly skewed, with many low-value customers and few high-value ones
- CLV-Frequency Correlation: Strong positive correlation (0.78)
Cohort Analysis
Customer Retention by Cohort

Cohort Analysis Findings:
- First Month Drop: Significant drop in customer retention after the first month (common pattern in retail)
- Long-term Retention: Older cohorts show better long-term retention rates
- Seasonal Patterns: Cohorts acquired during certain months (e.g., November) show better retention
- Best Performing Cohort: December 2010 cohort has the highest long-term retention
- Worst Performing Cohort: April 2011 cohort has the lowest retention rates
- Business Implication: Focus on improving retention in the critical first 3 months after acquisition